Maintenance Window
A sysadmin on the night shift finds something in the server logs that shouldn't be there.
The routine never varied. Coffee from the third-floor machine because the one in the NOC tasted chemical. Badge in at 1:47 AM. Headphones on. Lo-fi playlist queued. Terminal open by 1:55.
The maintenance window ran 2:00 AM to 6:00 AM Pacific, every other Thursday. Patch, reboot, verify. Four hours of procedural work against a quiet network. Dara preferred it to anything that happened during business hours.
She SSH’d into prod-web-01 at 2:03 AM and ran uptime.
02:03:17 up 34 days, 7:42, 1 user, load average: 0.00, 0.00, 0.00
She looked at the numbers for three seconds before the discrepancy registered.
Zero load. This box handled six thousand requests per second during off-peak hours. She opened Grafana in the adjacent monitor. The dashboard showed normal throughput. Requests arriving, responses departing, latency steady at 12ms p99. Everything green.
She went back to the terminal.
$ cat /proc/loadavg
0.00 0.00 0.00 0/312 18774
Zero across all three averages. One-minute, five-minute, fifteen-minute. The server had been idle for at least fifteen minutes while every monitoring system reported thousands of successful requests per second.
She checked the next node. Same. Then the next. All nine servers in the cluster reported 0.00 load.
Dara opened a second terminal pane.
She pulled the application logs on prod-web-01. They scrolled in the familiar waterfall. JSON entries. Timestamps, trace IDs, HTTP methods, paths, status codes, response times. Standard output.
She watched for thirty seconds, letting the rhythm settle into something she could read. Then she pulled the raw access logs from the load balancer and put them side by side.
The application log showed a GET to /api/v2/feed completing at 02:04:11.334 with a 200 status and 43ms response time. The load balancer recorded a request to the same path at 02:04:11.112 that returned in 87ms. The trace IDs did not match.
She checked another entry. Different trace ID. Different response time. The status codes agreed. Nothing else did.
She scrolled through fifty entries. The application logs were evenly spaced. One entry every 0.167 seconds, distributed with absolute uniformity. No jitter. No clustering. No variation of any kind.
Real traffic does not arrive like that. Real traffic clusters around the top of the second, thins at the tail, bunches during keep-alive windows. These entries were metronomic. Perfectly synthetic.
The servers were reporting zero load. The monitoring dashboards were green. The logs were fabricated. And the actual requests were being processed somewhere she had not yet identified.
She picked up her phone and called Marcus, the on-call SRE. It rang six times. Voicemail. She called again. The call connected for half a second, then dropped. No voicemail prompt. No busy signal. Silence.
She opened Slack and typed into #incident-response:
@here seeing anomalous behavior across prod-web cluster. Zero load on all nodes. App logs appear fabricated. Need a second set of eyes.
The message appeared. The sent indicator turned blue. She watched it for two seconds. Then the message was not there.
Not deleted. There was no tombstone, no audit trail, no “[message deleted]” notice. The channel showed her message from last Tuesday, then nothing. As if the text had never been entered.
She typed: test
It appeared. Two seconds. Gone.
She typed: test 2
Same result.
Dara placed her hands flat on the desk. The NOC hummed around her. Three rows of monitors displayed green dashboards. The air conditioning cycled through its rhythm.
She was alone in the building, which was normal for 2 AM on a Thursday. That fact had never been relevant before.
She went back to the terminal. Methodical. If communications were compromised, she would document locally and escalate in person at shift change.
$ who
dara pts/0 2026-03-16 02:03 (10.40.2.15)
Just her session. She ran last to check login history.
The output filled the screen. Hundreds of entries from a single source IP: 10.40.99.7. Every session had started at exactly 02:00:00. Every one was listed as still active. The usernames were blank. Whitespace where the login name should have been.
She did not recognize the IP. The 10.40.99.x subnet was not in any allocation document she had ever reviewed. Their internal range stopped at 10.40.64.0/18. She had helped write the network architecture documentation two years ago. That subnet did not exist.
She pinged it.
$ ping -c 1 10.40.99.7
PING 10.40.99.7 (10.40.99.7) 56(84) bytes of data.
64 bytes from 10.40.99.7: icmp_seq=1 ttl=64 time=0.091 ms
Sub-millisecond response. Local network. Same switch at minimum. Possibly the same rack.
She checked the CMDB. No entry. No hostname. No asset tag. No purchase order. No rack location. No owner. The IP existed on the network but in no system of record.
She knew the protocol. Anomalous network activity from an unregistered IP: call security operations, document observations, step away from the terminal. Do not probe further. That was the runbook. Page 14, section 3.2, “Suspected Unauthorized Network Device.”
She had co-authored that section.
She ran nmap.
$ nmap -p 1-65535 10.40.99.7
The scan completed in under a second. A full port scan against 65,535 ports on a local network takes minutes. This took 0.8 seconds. Every port returned open. All of them. 22, 80, 443, 3306, 5432, 6379, 8080, 8443, 31337, 65535. Every single one.
A machine with 65,535 open ports is not a machine. It is a response. Something was listening on every port and answering every probe.
She connected to port 80.
$ curl http://10.40.99.7:80
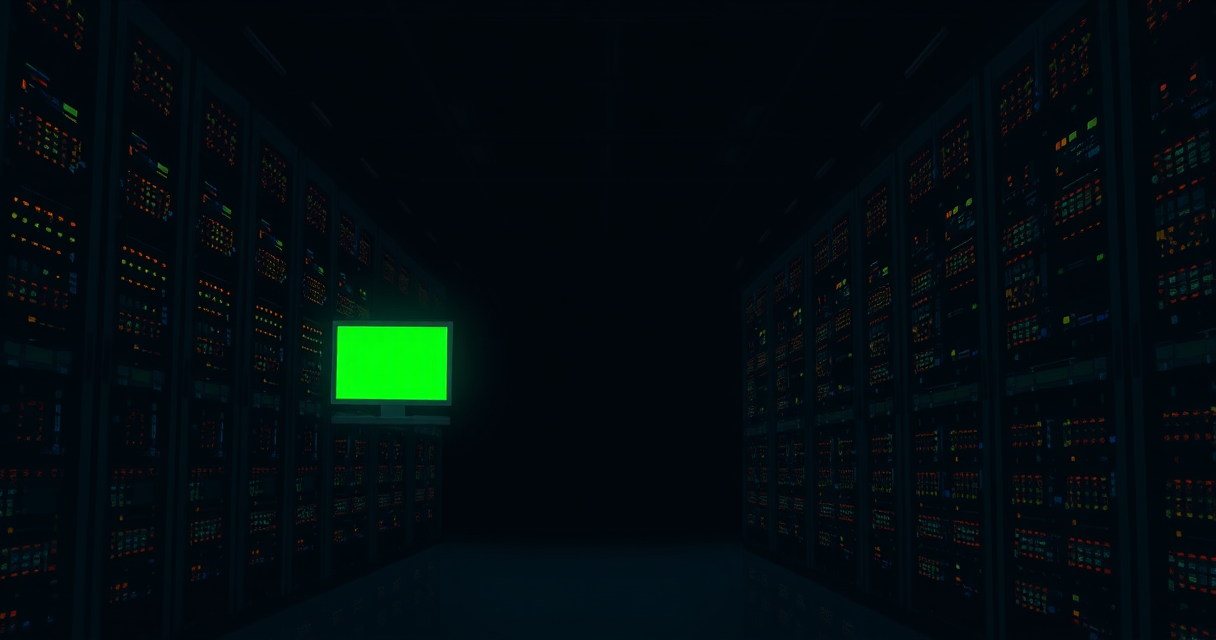
YOU ARE IN THE MAINTENANCE WINDOW
Port 443.
$ curl -k https://10.40.99.7:443
YOU ARE IN THE MAINTENANCE WINDOW
Port 22.
$ ssh 10.40.99.7
YOU ARE IN THE MAINTENANCE WINDOW
Connection closed.
She tried port 3306, port 5432, port 6379, port 8443, port 25, port 53. Every port. Every protocol. The same seven words returned each time.
YOU ARE IN THE MAINTENANCE WINDOW
Dara sat back and regulated her breathing. The fluorescent lights hummed. The terminal cursor blinked.
The sentence was not a warning. It was a description. She was in the maintenance window. The maintenance window ran from 2:00 to 6:00 AM. The system was telling her where she was.
She ran traceroute. Every hop was 10.40.99.7. Thirty hops, all the same address, all at 0.01ms. The network between her and the destination was the destination.
She checked the ARP table. The MAC address for 10.40.99.7 was 00:00:00:00:00:00. A null MAC. Ethernet cannot route to a null MAC address. This is not a convention. It is how the protocol works.
The packet had no valid path. But it arrived.
She tried to save her terminal output. Opened a file in vim, pasted the session history, wrote and quit. Ran cat on the file. Empty. She checked with ls -la. The file existed. Correct timestamp. Zero bytes.
She tried output redirection. curl http://10.40.99.7 > evidence.txt. The file was created. Zero bytes.
She took a photo of the screen with her phone. The photo showed her terminal displaying a standard bash prompt. No anomalous output visible. Just the cursor, blinking on an empty line.
Nothing about 10.40.99.7 could be persisted. It existed only in live observation. In the space between the command and the output. In the space where Dara was present and watching.
At 5:47 AM she noticed the clock. She had been sitting at the terminal for over three hours. Parts of that time she could account for. Parts she could not. There was a gap between approximately 5:20 and 5:47 where she had no memory of what she had been doing. Her coffee was cold and full. The lo-fi playlist had ended and her headphones were playing silence.
$ date
Thu Mar 16 05:47:33 PDT 2026
$ uptime
 05:47:41 up 34 days, 11:26, 1 user, load average: 0.00, 0.00, 0.00
Still zero. Thirteen minutes remaining in the window.
At 5:58 AM the load averages on prod-web-01 jumped to 4.72, 4.38, 4.15. Normal numbers for this cluster. The application logs became messy and real, full of the jitter and clustering that characterize actual traffic. Timestamps bunching, spreading, overlapping. The pattern of genuine requests.
Her Slack messages appeared in #incident-response. All six of them. Timestamped correctly across the previous four hours. As though they had been visible the entire time.
Marcus replied at 5:59 AM: “looks normal to me? what am I looking at?”
The login entries from 10.40.99.7 disappeared from the last output.
The IP stopped answering pings.
Dara wrote the incident report on Friday. She was thorough. She documented the zero load averages, the fabricated application logs, the silent communication failures, the unregistered IP, the port scan results, the identical response on every port, the null MAC address, the files that would not retain data, the photographs that captured nothing. She noted the time gap she could not account for.
The ticket was closed Monday morning. Resolution: “System behaved as expected during maintenance window. No action required.”
She filed an appeal. The appeal was closed within the hour. “Duplicate of MW-2847. See resolution.”
MW-2847 was her own ticket.
She did not work the next maintenance window. She told her manager she needed the Thursday off. He approved it without comment.
On Friday she came in early, before day shift, and logged into the jump box. She pulled the login history for March 16th. She expected to find her own session. Clean. Ordinary. The entries from 10.40.99.7 had been gone by the time everything normalized at 5:58 AM.
Her session was there. dara pts/0, logged in at 02:03.
The source IP was not what she expected.
It did not say 10.40.2.15. That was her workstation. The machine in the NOC where she had sat for four hours, drinking cold coffee and listening to lo-fi and typing commands into what she believed was a standard SSH session.
It said 10.40.99.7.
Dara looked at the entry for a long time. The NOC was quiet. The air conditioning cycled through its rhythm.
Her session. Her terminal. Her commands. Her keystrokes. According to the only record that would survive any audit, they had originated from the IP that did not appear in the CMDB, that had no hostname, no asset tag, no MAC address, and sixty-five thousand open ports, each returning the same seven words.
She had been physically present in the NOC. She was certain of this. She remembered the chair, the desk, the humming fluorescent tubes.
But the system of record did not place her there. The system of record placed her somewhere else. Somewhere that, according to every inventory and every network diagram, does not exist.
The system behaved as expected. That was the resolution. That was the only record that would persist.
Dara closed the terminal. She picked up her bag. She walked to the elevator and pressed the button for the parking garage. She did not look at the server room door as she passed it.
She thought about the drive home. She thought about coffee in her own kitchen, and the light coming through the east window, and how ordinary the morning would look from there.
The maintenance window was closed. The next one was in two weeks.
She had not yet decided whether she would be there for it.
Keep Reading
 culture
The Attention Economy Is a Hostage Situation
Attention was supposed to be the price of free services. It became the product. The architecture that followed was not designed for exchange. It was designed for capture.
 credential-exposure
One grep, full repo access
A security camera shipped a full-scope GitHub PAT in its login page bundle. The credential exposure, supply-chain exploit path, GitHub audit-log telemetry, and why rotation - not removal - is the only fix.
 credential theft
CVE-2026-44843 turns one chat message into credential theft
CVE-2026-44843 turns a single chat message into credential loss. An operator breakdown of the one-hop path from unauthenticated input to identity material.
Stay in the loop
New writing delivered when it's ready. No schedule, no spam.